STI Tenken sen (blue line) is levelling at 3160 while Kijun sen (red line) is moving higher to 3126. It is important to monitor closely that the blue line does not cross down the red line as this will indicate the start of a bearish trend. The near term support is adjusted lower to 3099 and the stronger support level is now at 3005. If STI continues the uptrend move, the support levels should reverse and start to move upward until the top (Span B) and bottom (Span A) of the cloud cross over.

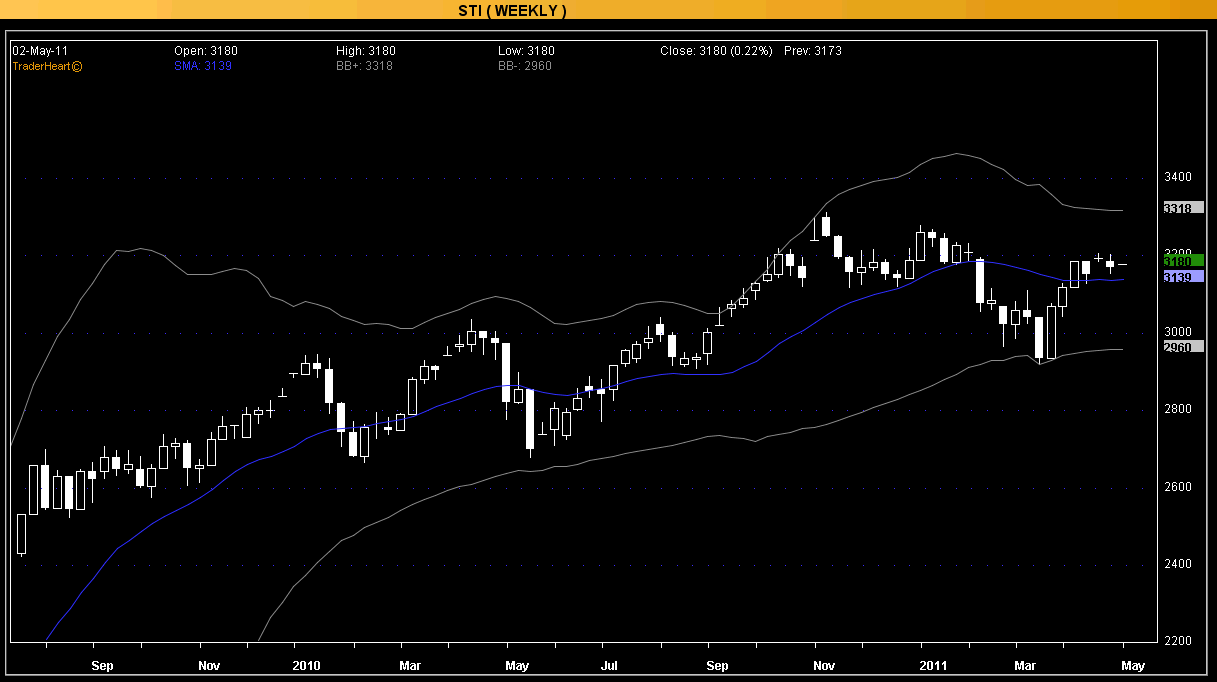
Bollinger Bands (weekly)
STI has stablised and looking for direction. A uptrend move will need it to break the resistance level at 3318. The middle band is at 3139 which will provide the first support level. If this support is broken, STI will go lower towards the 2960 support level of the lower band.
Disclaimer: All info posted is for reference only and not an inducement to buy or sell shares. You are solely responsible for your own actions.
No comments:
Post a Comment