Ichimoku Cloud (daily)
STI Tenken sen (blue line) is at 3138 while Kijun sen (red line) is leveling at 3147. The red line above the blue line indicates some bearishness, but since the difference is not much, it should still be a consolidation period awaiting a new direction to be confirmed. The near term support (Span B) is now at 3089 while the stronger support level (Span A) is moving closer to it at 3068. This could indicate the support at 3089 is getting stronger by the day. A cross over of Span A above Span B line will signify a new uptrend move.
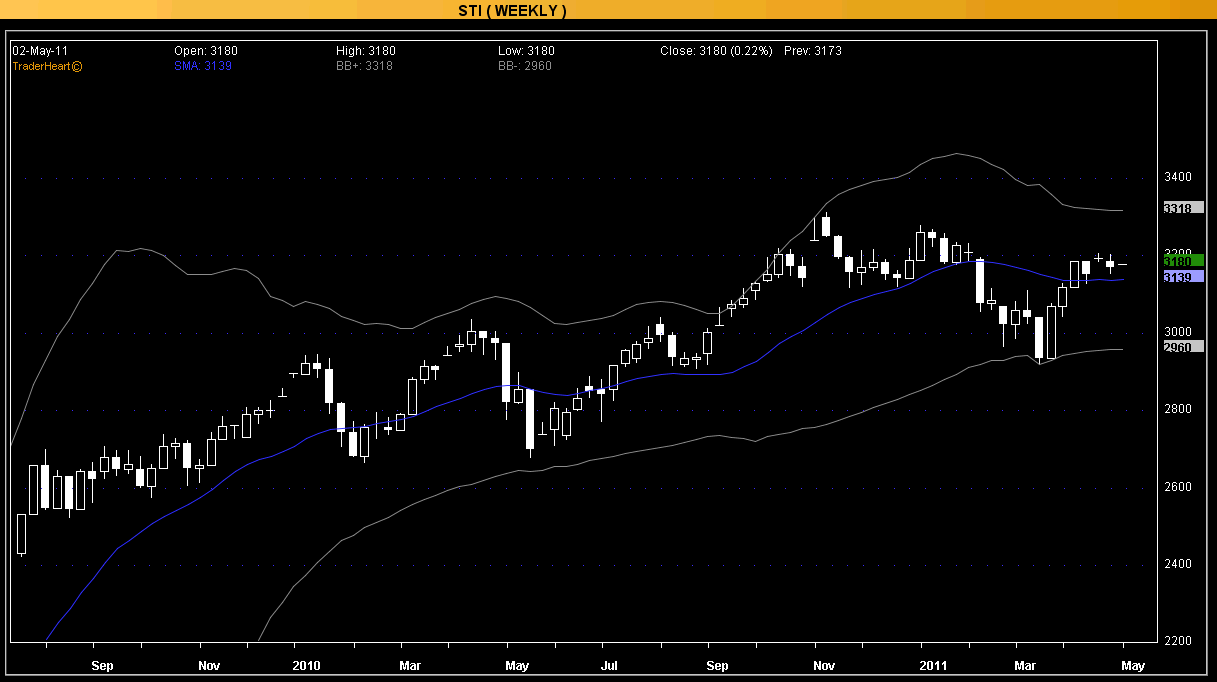
Bollinger Bands (weekly)
STI is still in consolidation mood and looking for a new direction based on last week recovery as shown by a similar to piercing line candlestick pattern. A uptrend move will need it to break the resistance level at 3315. The middle band is at 3136 which will provide the first support level. If this support is broken, STI will go lower towards the 2957 support level of the lower band.
Disclaimer: All info posted is for reference only and not an inducement to buy or sell shares. You are solely responsible for your own actions.