Ichimoku Cloud (daily)
STI has little movement in the past week, displayed by the many small body candles. Both Tenken sen (blue line) at 3145 and the Kijun sen (red line) at 3199 are still moving up together. There is a higher chance that the up trend may continue. As the cloud top has gone lower to 3100, 3145 is now a support level to monitor for any sudden change in the rising trend. The next resistance test is still the 3200 level where a few attempts in the past few months had failed to overcome confidently.
STI has little movement in the past week, displayed by the many small body candles. Both Tenken sen (blue line) at 3145 and the Kijun sen (red line) at 3199 are still moving up together. There is a higher chance that the up trend may continue. As the cloud top has gone lower to 3100, 3145 is now a support level to monitor for any sudden change in the rising trend. The next resistance test is still the 3200 level where a few attempts in the past few months had failed to overcome confidently.

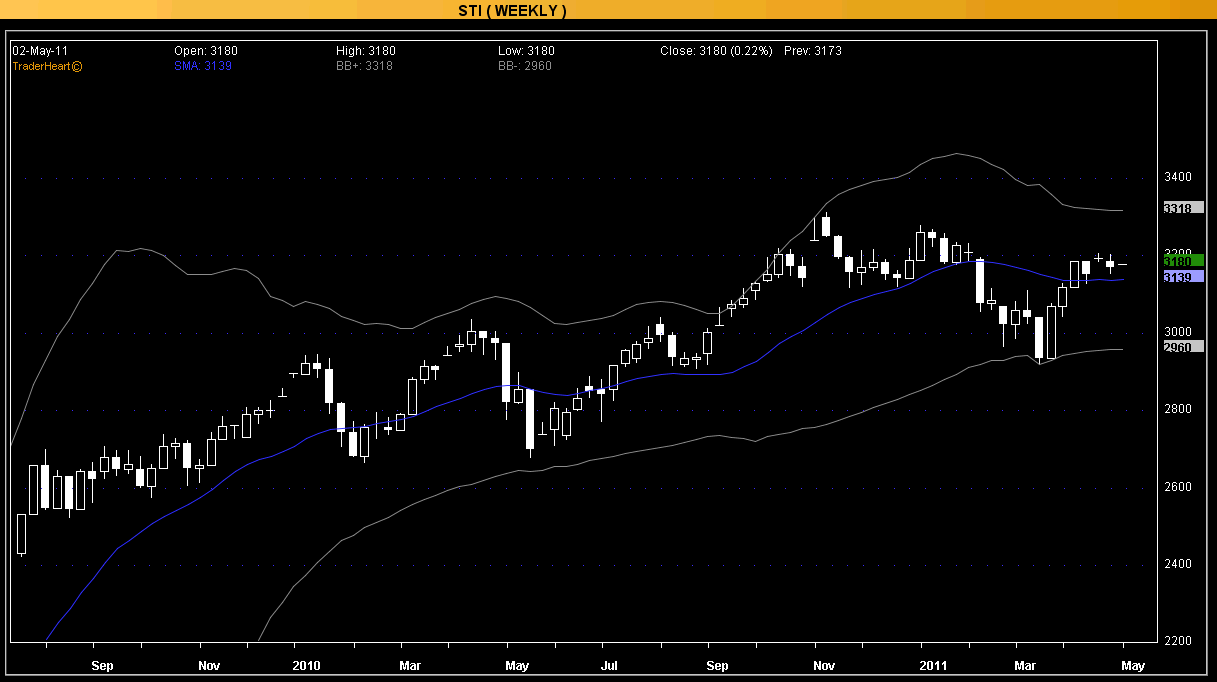
Bollinger Bands (weekly)
Weekly STI has shown a slow down in moving up after last week's bullish mood. This is a cautious reaction. The upper band is same at 3256 (resistance level) and the lower band is higher at 2988 (support level). Middle band is also moving higher at 3122, which is a good sign for the bulls. The next challenge for STI is to go above the upper band convincingly in the coming weeks.

Disclaimer: All info posted is for reference only and not an inducement to buy or sell shares. You are solely responsible for your own actions.


