TraderHeart Main Features
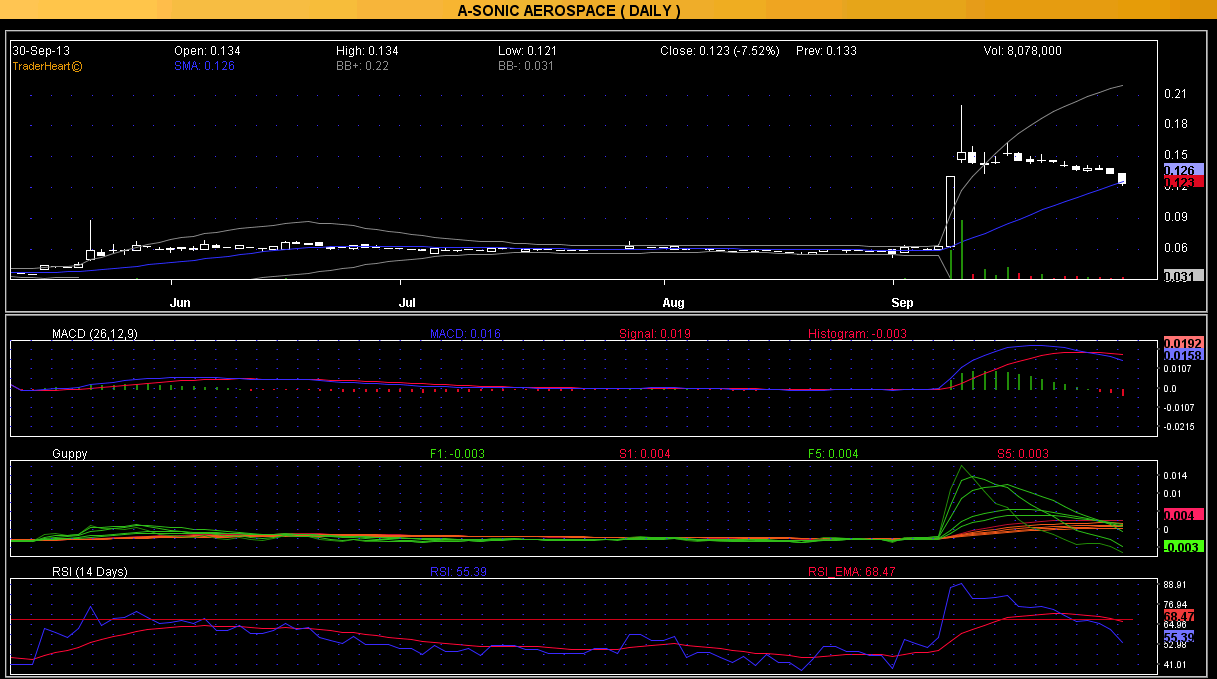
1. Chart Indicators View
The chart indicator view allows up to 3 different indicators to be displayed below the main chart view.
2. Stock Code View
The stock code view provides a quick understanding of the recent price and volume trend. To assess quickly the bullishness or bearishness of the stock, users can determine the trend by simply comparing the number of lines of green colour vs the red colour.
3. Dashboard View
Dashboard as the name implies is to give users the overview of the price trend in short term, mid term and long term outlook. Reversal probability is also shown in this view. The risk give users a general guidance on the upcoming trend.
4. Edit Watchlist View
Up to 60 stocks can be defined for each of the 6 watchlists. By using different file names, the number of watchlists is up to the users to determine.
5. EMA Summary View
This page shows the ratings of all trend indicators.
6. Oscillators Summary View
This page shows the ratings of all oscillating indicators.
7. Point and Figure (P&F) Chart View
Point and figure chart plots price against
changes in direction. Column of Xs is plotted as the price rises and column of Os is plotted as the price falls. Users can configure all chart types in this software to their preference and customise the tools to aid their own trading techniques.
8. Kagi Chart View
Kagi chart will show to the users the path of price movements. It is independent of
time and direction is changed only when a specific amount of rise or fall is
reached. The screen can be split into two to compare the Kagi pattern with the normal trend pattern.
9. Renko Chart View
Renko chart is also time independent like Kagi chart. It is very useful in identifying trends and trend direction. Green bricks represent bullish trend, and orange bricks are indicating bearish trend.
10.Three Line Break Chart View
Three Line Break chart ignore time and only change when prices move a specific amount. The high or low of the prior two lines sets the reversal point. Filtering out the noise by focusing exclusively on price changes is useful to determine the underlying trend.
11. Scan Report View
The scanner will scan through the watchlist of stocks and present the summary of the stock rating and ranking in an easy to understand view.
12. Portfolio View
The portfolio view is the page for managing trades. Open trades and closed trades are displayed in separate windows. Trades done with different brokers can be managed and tracked in this single location.
.jpeg)
.jpeg)
.jpeg)

.jpeg)
.jpeg)


.jpeg)
.jpeg)