.jpeg)
Tuesday, 22 October 2013
A-Sonic Chart Analysis: Bollinger Band Is Narrowing
Stock price is hovering around 0.10 cents as there is no strong impetus to drive the stock price in either direction. Volume is also low. All signs show that most traders are still wary of the recent fall and are choosing to stay on the sideline. Will there be any more news on the aircraft leasing business?
.jpeg)
Wednesday, 9 October 2013
A-Sonic Chart Analysis: Renko Chart
A-Sonic is recovering for 2 days after many oscillator indicators show that the stock is oversold. Volume is relatively low. Buyers are still skeptical. Unless there is a push above 0.10, based on the Renko Chart, the bearish mood will probably linger until there is more news on the aircraft leasing business.
CEO Janet Tan's open market purchase of 250,000 shares at 0.125 is suffering a big loss. Let's see if she has the grit to push the price higher than the purchase price.

Saturday, 5 October 2013
A-Sonic Chart Analysis: 50% Fibonacci Retracement Level
A-Sonics has dropped to slightly below 50% Fibonacci Retracement level at 0.092. The penny fallout across the market definitely has an effect on the price drop. Furthermore, the company CEO brought 250,000 shares at S$0.12496 each at open market on 1 Oct did not help at supporting the stock price. This is a negative sign to prospective buyers.

Oscillator indicators like STOC & CCI are in oversold region. Next week direction will be dependent on the market sentiment toward penny stocks. Average daily volume is relatively low as compared to during the surge on 9 & 10 September 2013. Are the buyers holding back or are BBs pushing the price down to force more shareholders to let go their holdings?
.jpeg)
Thursday, 3 October 2013
A-Sonic Chart Analysis: Price Fall, Sellers Triumph
A-Sonic has fallen to 61.8% fibonacci level. The sellers have triumphed over the longists in the battle to set the trend. The flag formation has been negated. Will the sellers continue to push the price below 0.10?
.jpeg)
.jpeg)
Monday, 30 September 2013
A-Sonic Chart Analysis: Gap Closed, Testing Moving Average As US Federal Shutdown Looming
Due to the possible US federal shutdown, A-Sonic is testing the moving average support level at 0.126. Will it continue to go down from here? MACD and Guppy indicators are in negative region. RSI is below 70.
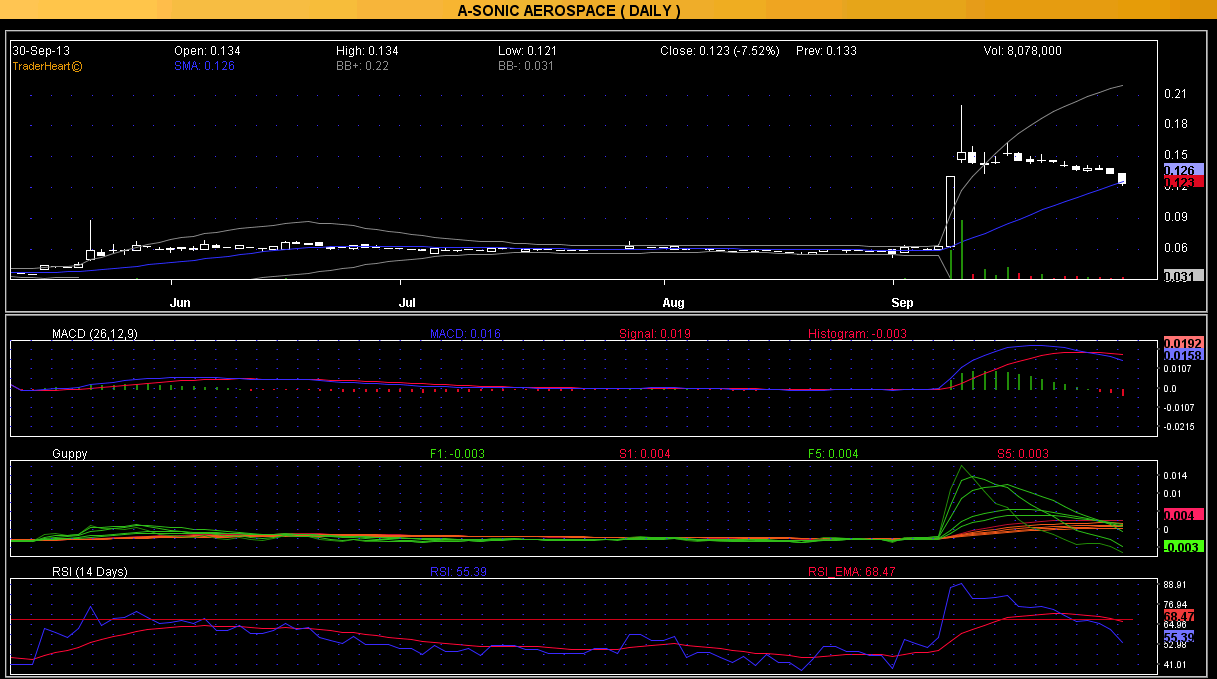
The weekly chart provides a picture of a nice flag pole. Support level is at 0.119. Resistance is at 0.145.
.jpeg)
Sunday, 29 September 2013
A-Sonic Chart Analysis - Rising Moving Average Near Stock Price
A-Sonic's 20-day moving average is rising to 0.122, also approaching the 0.131 price gap on 9 -10Sep. Will this reinforce the 0.131 support level after a week long of declining prices? Will sellers be eager to test this support level? Will buyers allow the support level to be tested? A point to note is the trading volume is declining over the last 3 days. It's a sign that both sellers and buyers are wary of the approaching support level. The flag formation is not negated yet. Interesting time ahead for this stock.
.jpeg)
Weekly chart displays a more calming trend. 1st support is at 0.124. Next week stock price movement will likely show a more clearer trend pattern. 1st resistance is at 0.145 and the next resistance is at 0.166.
.jpeg)
.jpeg)
Weekly chart displays a more calming trend. 1st support is at 0.124. Next week stock price movement will likely show a more clearer trend pattern. 1st resistance is at 0.145 and the next resistance is at 0.166.
.jpeg)
.jpeg)
Thursday, 26 September 2013
A-Sonic Chart Analysis - SAR - Price Stops Going Higher

Fibonacci Uptrend Supporting level of 0.126 at 76.4% marking is still intact. Next support level is at 0.108.
.jpeg)
.jpeg)
Sunday, 22 September 2013
A-Sonic Chart Analysis - Flag Pole Formation
A-Sonic has a flag pole formation on 9 September 2013 to 20 September 2013. Near resistance at 0.155. Price gap at 0.131 to 0.145. Strong support at 0.131.
.jpeg)
.jpeg)
Saturday, 21 September 2013
TraderHeart Main Features
1. Chart Indicators View
The chart indicator view allows up to 3 different indicators to be displayed below the main chart view.

2. Stock Code View
The stock code view provides a quick understanding of the recent price and volume trend. To assess quickly the bullishness or bearishness of the stock, users can determine the trend by simply comparing the number of lines of green colour vs the red colour.

3. Dashboard View
Dashboard as the name implies is to give users the overview of the price trend in short term, mid term and long term outlook. Reversal probability is also shown in this view. The risk give users a general guidance on the upcoming trend.

4. Edit Watchlist View
Up to 60 stocks can be defined for each of the 6 watchlists. By using different file names, the number of watchlists is up to the users to determine.

5. EMA Summary View
This page shows the ratings of all trend indicators.

6. Oscillators Summary View
This page shows the ratings of all oscillating indicators.

7. Point and Figure (P&F) Chart View
Point and figure chart plots price against changes in direction. Column of Xs is plotted as the price rises and column of Os is plotted as the price falls. Users can configure all chart types in this software to their preference and customise the tools to aid their own trading techniques.

8. Kagi Chart View
Kagi chart will show to the users the path of price movements. It is independent of time and direction is changed only when a specific amount of rise or fall is reached. The screen can be split into two to compare the Kagi pattern with the normal trend pattern.

9. Renko Chart View
Renko chart is also time independent like Kagi chart. It is very useful in identifying trends and trend direction. Green bricks represent bullish trend, and orange bricks are indicating bearish trend.

10.Three Line Break Chart View
Three Line Break chart ignore time and only change when prices move a specific amount. The high or low of the prior two lines sets the reversal point. Filtering out the noise by focusing exclusively on price changes is useful to determine the underlying trend.

11. Scan Report View
The scanner will scan through the watchlist of stocks and present the summary of the stock rating and ranking in an easy to understand view.

12. Portfolio View
The portfolio view is the page for managing trades. Open trades and closed trades are displayed in separate windows. Trades done with different brokers can be managed and tracked in this single location.

Subscribe to:
Comments (Atom)